
Introduction #
Many industrial transmitters report humidity, wind, pressure, level or position as a 0–10 V signal that is proportional to the measured value. Reading such a signal well takes more than a wire: the voltage has to be brought into the ADC’s range, converted to engineering units with the right scaling, and filtered so the display stays steady. Angle signals such as wind direction also wrap around, which needs special care.
This tutorial builds an ESP32 industrial weather monitoring system on the NORVI X-CPU-ESPS3-X1 with the NORVI X-AV4 module. You connect three 0–10 V transmitters (a Sentera DSTHF-3 humidity transmitter, a WG2/O-10 wind speed transmitter and a WRG/O-40 wind direction transmitter), scale each one to %RH, m/s and degrees, average eight readings per update (with a circular average for direction), and show the values, gauges and a compass dial on the built-in TFT display. The same method suits any 0–10 V transmitter: pressure, level, damper or valve position, or a linear position sensor. Only the span constants change.
What you will need
- NORVI X-CPU-ESPS3-X1 controller and NORVI X-AV4 module
- 24 V DC supply
- 0–10 V transmitters: humidity (Sentera DSTHF-3), wind speed (WG2/O-10) and wind direction (WRG/O-40), or equivalents with a 0–10 V output
- Shielded twisted-pair cable, an adjustable 0–10 V source and a multimeter for commissioning
- USB cable and the Arduino IDE with ESP32 board support
System Architecture #
The system forms a short signal chain from the field transmitters to the operator display.
Figure 1: Signal path of the ESP32 0–10 V weather monitoring system
Signal flow #
- Sensing. Each transmitter outputs 0–10 V in proportion to its measuring range: 0–100 %RH, 0–50 m/s and 0–360°.
- Conversion. The X-AV4 divides each input down so it fits the ADS1115 (3.3 V supply, 16-bit). The sketch runs the ADC at GAIN_ONE (±4.096 V, 125 µV per count).
- Processing. The ESP32-S3 reads three channels over I²C, averages eight readings each, undoes the divider ratio, scales the result to engineering units and checks for faults.
- Indication. The controller draws wind speed, a compass dial and humidity into an off-screen buffer and pushes it to the TFT twice a second.
Hardware components #
| Component | Role | Key details |
|---|---|---|
| NORVI X-CPU-ESPS3-X1 | Controller | ESP32-S3-WROOM-1U-N16R2 with 16 MB flash and 2 MB QSPI PSRAM; 2.0 in ST7789 TFT (240 × 320); 24 V DC supply |
| NORVI X-AV4 | 0–10 V input module | 4 analog channels; ADS1115 16-bit ADC (3.3 V) at I²C address 0x49 with DIP 1 ON; powered through the expansion port (40 mA at 24 V) |
| Sentera DSTHF-3 | Humidity transmitter | Duct transmitter, 0–100 %rH (non-condensing), ±3 %rH; 18–34 V DC, 80 mA; humidity on output AO2 (0–10 V) |
| WG2/O-10 | Wind speed transmitter | 0–50 m/s = 0–10 V; ±0.5 m/s or ±3 % of reading; 13–30 V DC or 24 V AC/DC, 50 mA |
| WRG/O-40 | Wind direction transmitter | 0–360° = 0–10 V; ±1.5°, 1° resolution; 15–28 V DC or 24 V AC |
Pin allocation #
| Function | GPIO / channel | Notes |
|---|---|---|
| I²C bus (SDA / SCL) | IO8 / IO9 | Shared by the ADS1115 on the X-AV4 (0x49 here) and the on-board touch, I/O expander and RTC devices |
| TFT display (CS / DC / RST) | IO45 / IO46 / IO47 | ST7789 panel on the SPI bus |
| Shared SPI (MOSI / MISO / SCLK) | IO11 / IO13 / IO12 | Display, Ethernet controller and SD card share these lines |
| Humidity input | AIN1 (ADS1115 ch 0) | readADC_SingleEnded(0) |
| Wind speed input | AIN2 (ADS1115 ch 1) | readADC_SingleEnded(1) |
| Wind direction input | AIN3 (ADS1115 ch 2) | readADC_SingleEnded(2) |
| Spare input | AIN4 (ADS1115 ch 3) | Free for a fourth 0–10 V transmitter |
| Common return | AGND | Shared analog ground for all inputs |
Hardware and Wiring #
X-AV4 at a glance #
| Parameter | Value |
|---|---|
| Inputs | 4 channels, 0–10 V, AIN1 to AIN4 with a common return AGND |
| ADC | ADS1115, 16-bit, I²C (SDA IO8, SCL IO9), 3.3 V supply |
| I²C address | Set by DIP switch: DIP 1 ON = 0x49 (used here) |
| Terminals | AIN1 to AIN4 and AGND (push-in) |
| Supply | 24 V DC through the expansion port, 40 mA |
| Environment | −40 to +85 °C |
Connect the module and the sensors #
- Power off the system.
- Mount the X-AV4 on the DIN rail beside the X-CPU and seat it on the expansion bus connector.
- Set DIP 1 ON and DIP 2 to 4 OFF for address 0x49.
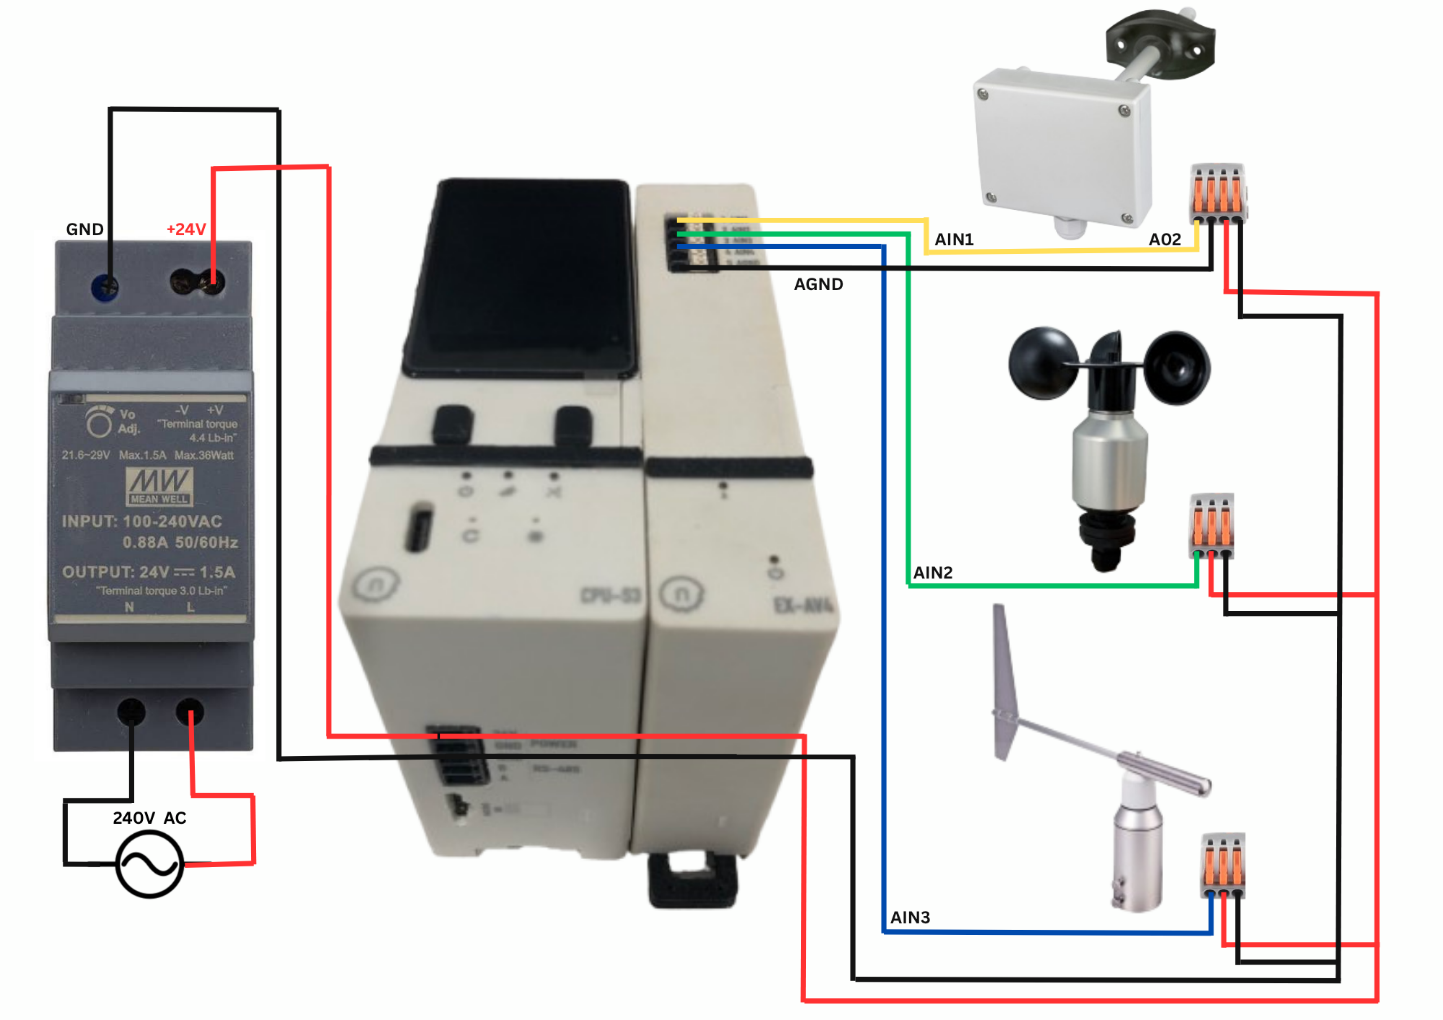
- Wire each transmitter’s signal output to its input terminal as in the table below, and tie the sensor 0 V to AGND as in Figure 2.
- Connect the 24 V DC supply to the X-CPU power terminals and to the supply inputs of the three transmitters, with the supply 0 V joined to AGND, then power on.
| Terminal | Transmitter | Signal used | Scaling |
|---|---|---|---|
| AIN1 | Sentera DSTHF-3 | AO2 (relative humidity) | 0–10 V = 0–100 %RH |
| AIN2 | WG2/O-10 | Wind speed output | 0–10 V = 0–50 m/s |
| AIN3 | WRG/O-40 | Wind direction output | 0–10 V = 0–360° |
| AIN4 | Not used | — | — |
| AGND | All sensor 0 V and supply 0 V | Common return | — |
Sensor wiring practice #
Use shielded twisted-pair cable for the signal wires and connect the shield at one end only. Route the cables away from motor, VFD, AC and relay wiring. Follow the pin table supplied with each transmitter: Figure 2 shows the signal functions.
- Supply. Connect 24 V DC to the supply input of each transmitter in parallel, as in Figure 2.
- Signals. Wire the humidity output (AO2) to AIN1, the wind speed output to AIN2 and the wind direction output to AIN3, with each transmitter’s GND going to AGND.
- Common ground. Join the supply 0 V to AGND once, at the X-AV4.
- DSTHF-3. Wire the supply GND to the supply 0 V and the GND beside AO2 to AGND, using separate wires.
How a 0–10 V Signal Is Read #
The ADS1115 runs from 3.3 V and cannot accept 10 V directly, so the X-AV4 divides each input down first. The sketch sets the ADC to GAIN_ONE (±4.096 V, 125 µV per count), reads the divided voltage and undoes the divider in software:
V_terminal = V_adc ÷ DIVIDER (DIVIDER = 0.3125)
DIVIDER comes from the resistor divider on each X-AV4 input: a 3.3 kΩ series resistor and a 1.5 kΩ resistor to AGND, so DIVIDER = 1.5 ÷ (3.3 + 1.5) = 0.3125. With this ratio a full-scale 10 V signal reaches the ADC as 3.125 V. Use the values below to check the chain during commissioning.
| Terminal | ADC input | Expected count | Humidity | Wind speed | Direction |
|---|---|---|---|---|---|
| 0.0 V | 0.000 V | 0 | 0 %RH | 0 m/s | 0° |
| 2.5 V | 0.781 V | 6250 | 25 %RH | 12.5 m/s | 90° |
| 5.0 V | 1.563 V | 12500 | 50 %RH | 25 m/s | 180° |
| 7.5 V | 2.344 V | 18750 | 75 %RH | 37.5 m/s | 270° |
| 10.0 V | 3.125 V | 25000 | 100 %RH | 50 m/s | 360° |
| 10.5 V (limit) | 3.281 V | 26250 | FAULT | FAULT | FAULT |
Ideal values for DIVIDER = 0.3125, GAIN_ONE and spans of 100 %RH, 50 m/s and 360°. Real modules vary with resistor tolerance (see Section 5.3).
- Why GAIN_ONE. It covers the divided signal with headroom above 10 V (up to 13.1 V at the terminal), so an over-range input can be detected, and it keeps the resolution at 125 µV per count. The X-AV4 user guide example uses GAIN_TWOTHIRDS (±6.144 V), which also works at 187.5 µV per count.
- Resolution. One count is 0.4 mV at the terminal (125 µV ÷ 0.3125): 0.004 %RH, 0.002 m/s or 0.014°. That is far finer than the transmitters themselves (±3 %rH, ±0.5 m/s or ±3 %, ±1.5°), so the sensor, not the ADC, limits the accuracy.
- Negative and over-range readings. The sketch clamps negative voltages to 0 V and treats anything above 10.5 V as a fault (Section 6.2).
Scaling to Engineering Units #
Linear scaling #
A 0–10 V transmitter is linear, so one formula converts the terminal voltage to the measured value. For a span that starts at zero it is a simple ratio; for any span it is:
value = min + (V ÷ 10) × (max − min)
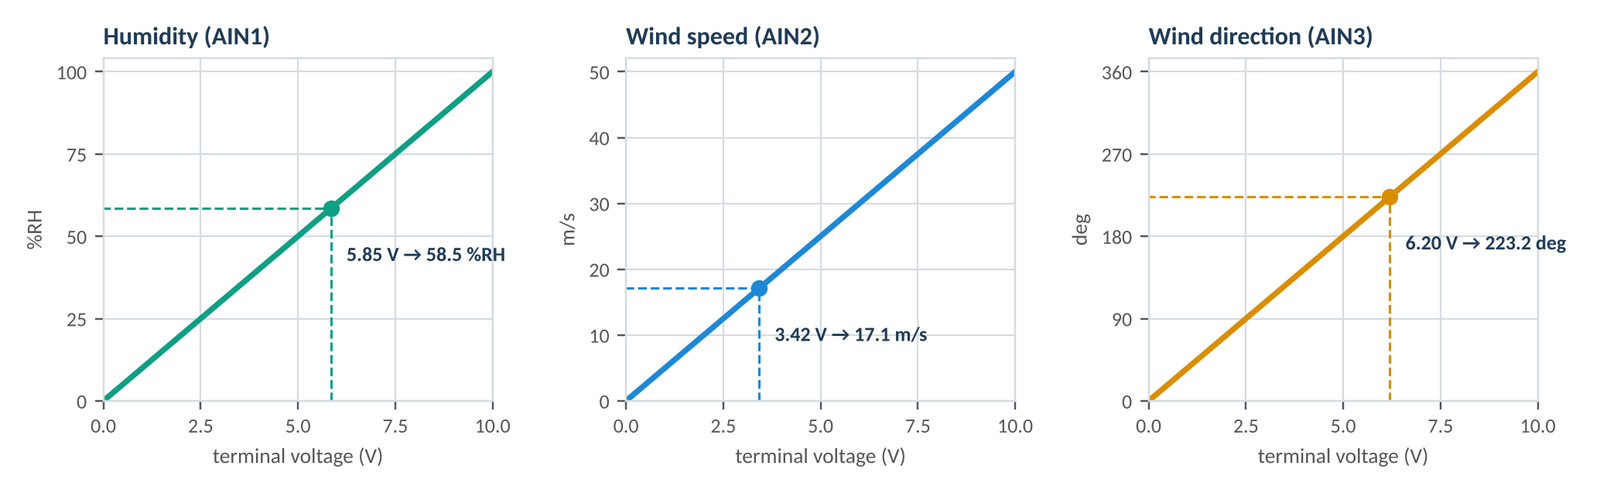
- Humidity. 5.85 V ÷ 10 × 100 = 58.5 %RH. The ADC sees 1.828 V, a count of 14625.
- Wind speed. 3.42 V ÷ 10 × 50 = 17.1 m/s. The ADC sees 1.069 V, a count of 8550.
- Wind direction. 6.20 V ÷ 10 × 360 = 223.2°. The ADC sees 1.938 V, a count of 15500. The compass name comes from 16 sectors of 22.5°, so 223.2° falls in SW.
Position transmitters and other spans #
The wind vane is an angular position transmitter, and the same method serves any 0–10 V position transmitter: change the span constant to 100 mm for a linear transducer, or to 100 % for a damper or valve position. If a transmitter uses an offset range such as 2–10 V, subtract the offset in the formula: min + (V − 2) ÷ 8 × (max − min). Check which output range your transmitter is set to before you scale it. For a 0–360° signal, 0° and 360° are the same physical position, so averaging needs the circular method in Section 6.1.
Calibrate the divider ratio #
DIVIDER = 0.3125 follows from the 3.3 kΩ and 1.5 kΩ resistors on each X-AV4 input. Resistor tolerance can move the true ratio slightly, so check it once with a known voltage.
- Disconnect the transmitter from one channel (for example AIN2) and apply a known voltage between that input and AGND, using a calibrator or an adjustable supply measured with a multimeter. Try 5.00 V and 10.00 V and never go above 10 V.
- Convert the displayed value back to volts. For wind speed, volts = m/s ÷ 50 × 10.
- Set the new ratio: DIVIDER (new) = DIVIDER (old) × displayed volts ÷ applied volts.
For example, if 10.00 V is applied and the display shows 48.5 m/s (9.70 V), the new ratio is 0.3125 × 9.70 ÷ 10.00 = 0.3031. If the error is not proportional (different percentages at 5 V and 10 V), look for a wiring or ground problem first.
Filtering and Fault Detection #
Averaging and the circular mean #
On every update the sketch reads each channel eight times and averages the readings. Random pickup noise falls by about √8, roughly 2.8 times. Each reading is a single-shot conversion at the library’s default 128 samples per second (about 8 ms), so one update takes roughly 0.2 s, and the screen is refreshed every 500 ms. Raise SAMPLES for a steadier display; each extra sample adds about 25 ms for the three channels.
Wind direction needs a circular average. The output jumps from 10 V to 0 V when the vane crosses north. A plain average of two readings taken either side of north, 359° (9.972 V) and 1° (0.028 V), gives 5.0 V, which is 180° and points the wrong way. The sketch instead turns each reading into an angle, sums the cosines and sines, and takes the angle of the result, which gives 0° for this pair:
const float a = d / 10.0f * 2.0f * (float)M_PI;   // volts -> radians
sx += cosf(a);  sy += sinf(a);                     // inside the 8-sample loop
...
float deg = atan2f(sy, sx) * 180.0f / (float)M_PI;
if (deg < 0) deg += 360.0f;
Optional extra smoothing. The sketch has no filter beyond the eight-sample average. For a slower, calmer display add an exponential filter, x = x + alpha × (new − x), with alpha between 0.1 (slow) and 0.5 (quick). For direction, filter the sine and cosine sums, never the angle itself. Weather reporting commonly uses longer averages, for example 10 minutes, so add a slower filter if you need that.
Fault detection #
| Condition | Meaning | Firmware action |
|---|---|---|
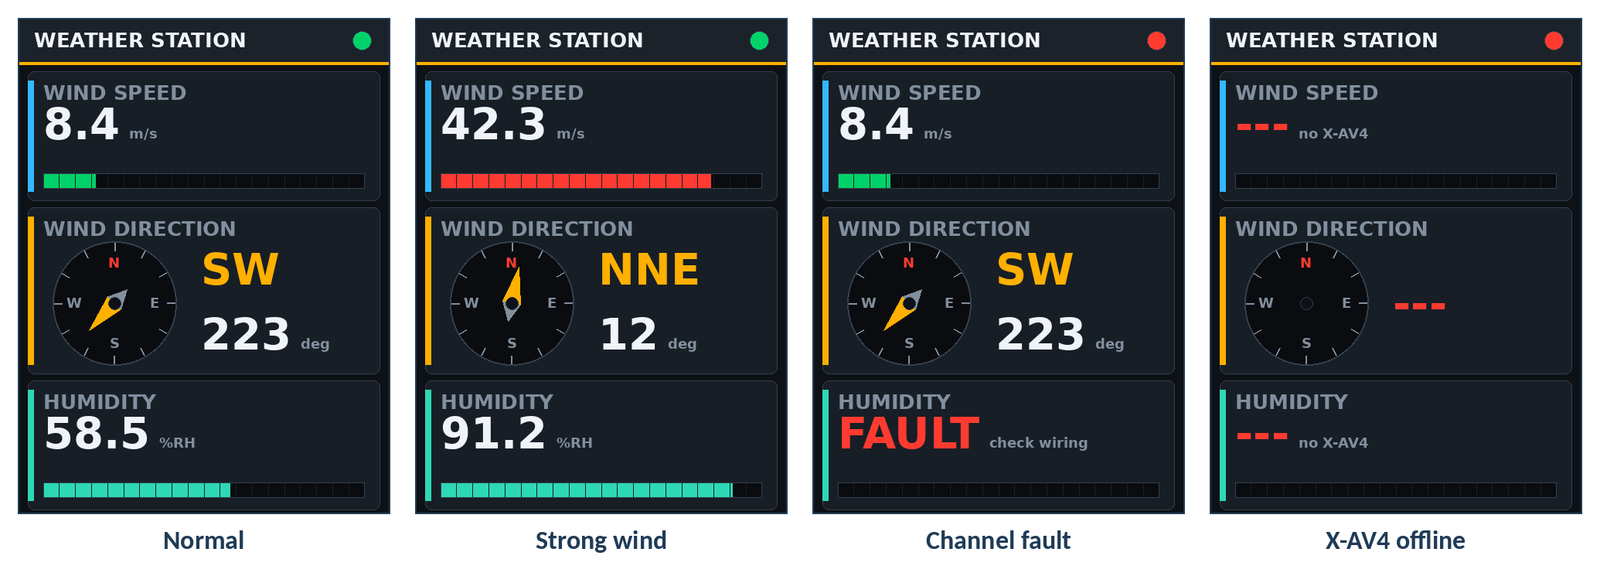
| Voltage above 10.5 V on a channel | Out-of-range output, wrong sensor variant or wiring, or supply voltage on the signal line | That channel shows FAULT and “check wiring”; header LED turns red |
| No answer from the ADS1115 | X-AV4 not seated, DIP address does not match ADS_ADDR, or an I²C fault | All channels show “—” and “no X-AV4”; red LED; retries every 500 ms |
| 0 V on a channel | A valid zero, or an open signal wire or unpowered transmitter (a 0–10 V signal has no live zero) | Not detected: shown as 0 |
| 0 to 10.5 V | Valid measurement | Scale to engineering units and display |
Because 0 V is also a valid reading, a broken wire on the wind speed input looks like calm air. For humidity, 0 %RH is unrealistic, so you can add a low limit (for example below 1 %RH) that raises a fault, and you should always confirm the wind sensors by turning them by hand during commissioning.
Reading the screen #
- Header LED blinks green on every update while all channels are healthy and turns red on any fault.
- Wind speed shows the value in m/s and a 20-segment gauge over 0–50 m/s: green below 50 % of range (25 m/s), amber from 50 to 80 %, and red from 80 % (40 m/s).
- Wind direction shows a compass dial with a red N, an amber needle, the 16-point name and the angle in degrees.
- Humidity shows the value in %RH and a teal gauge over 0–100 %RH.
- A faulty channel shows FAULT or “—” in red, with its gauge empty.
Arduino Code for the Weather Monitoring System #
Set up the IDE #
- Select ESP32S3 Dev Module, then set USB CDC On Boot to Enabled, Flash Size to 16MB (128Mb) and PSRAM to QSPI PSRAM.
- Install Adafruit ADS1X15 (with its BusIO dependency) and LovyanGFX from the Library Manager. Wire, SPI and math come with the ESP32 core.
How the sketch works #
- Non-blocking timing. The loop returns at once until 500 ms have passed since the last update, so nothing stalls the controller.
- Off-screen sprite. Each frame is drawn into a 240 × 320 buffer in PSRAM and pushed to the TFT in one go, which removes flicker. If the buffer cannot be allocated the sketch prints a message and shows “Display buffer failed”.
- Hot recovery. Every update checks that the ADS1115 still answers. If the X-AV4 drops off the bus the screen shows the offline state, and the ADC is restarted automatically when it answers again.
What the main parts of the code do #
The complete sketch is available on GitHub: https://github.com/NORVIControllers/NORVI-X-Version-02/tree/main/Application%20Guides/weather-monitoring-system-on-x-av4 (also listed under Resources). The settings at the top are the values you change to suit your sensors:
| Constant | Default | Change it when |
|---|---|---|
| ADS_ADDR | 0x49 | The X-AV4 DIP switches are set to another address |
| DIVIDER | 0.3125 | Calibration shows a different divider ratio (Section 5.3) |
| HUM_MAX_PCT | 100 | The humidity output is ranged to something other than 0–100 %RH at 10 V |
| WIND_MAX_MS | 50 | The wind speed transmitter has a different full scale (the WG2/O is 0–50 m/s) |
| OVER_RANGE_V | 10.5 | You want more or less headroom before a channel is called faulty |
| SAMPLES | 8 | You want a steadier display (more samples) or a faster update (fewer) |
| UPDATE_MS | 500 | You want a faster or slower screen refresh |
- Reading a channel. Takes one ADS1115 reading, converts it to volts and divides by DIVIDER to give terminal volts, clamped at 0 V.
- Averaging. Reads all three channels SAMPLES times, averages humidity and wind speed as plain voltages, and averages direction as a vector.
- Scaling. Turns each averaged voltage into %RH, m/s and degrees with V ÷ 10 × span, and names the compass point from 16 sectors of 22.5°.
- Fault check. Marks a channel faulty above OVER_RANGE_V, and marks all channels offline when the ADS1115 does not answer.
- Drawing the screen. Draws the header, three panels, the gauges and the compass dial off-screen, then sends the finished picture to the display in one step.
- Start-up. Starts I²C on IO8 and IO9, starts the display on the shared SPI bus, creates the PSRAM buffer and starts the ADC.
The scaling lines inside the update loop are:
const float wind = vWind / 10.0f * WIND_MAX_MS;   // 0-10 V -> 0-50 m/s
const float hum  = vHum  / 10.0f * HUM_MAX_PCT;   // 0-10 V -> 0-100 %RH
Commissioning and Test #
Commissioning checklist #
- Power supply. Verify that the 24 V DC supply is stable and correctly wired to the X-CPU and to the three transmitters before you energize the system.
- I²C address. Confirm DIP 1 is ON and the Serial Monitor shows no “X-AV4 not found” message. For a full check, run the I²C scan below.
- Voltage injection. With the transmitters disconnected, apply 0, 2.5, 5, 7.5 and 10 V between each input and AGND. The display should match the table in Section 4. If it is off by a constant percentage, calibrate the divider (Section 5.3).
- Wind direction. Reconnect the transmitter and turn the vane to each compass point, checking N, E, S and W against a compass. Align the sensor’s north mark as its installation instructions describe, since the sketch has no direction offset.
- Wind speed. Spin the cups by hand. The value should rise and fall back to about 0 m/s when they stop.
- Humidity. Measure the voltage at AIN1: it should equal %RH ÷ 10 (58.5 %RH is 5.85 V). Compare with a reference hygrometer in the same air, and exhale near the probe to see a quick rise. If the reading is low at high humidity, see the load note in Section 3.3.
- Fault response. Power off, remove the X-AV4 and power on: all channels should show “—” and “no X-AV4” with a red LED. Power off again, reseat the module and power on to confirm normal operation. Do not connect or disconnect the module while powered.
To scan the I²C bus, call this function from setup() after Wire.begin(). The scan lists 0x49 (X-AV4), 0x41 (PCA9536), 0x15 (touch controller), 0x68 (RTC) and 0x75 (I/O expander). It is not part of the weather sketch, so add it while commissioning.
void i2cScan() {
  for (byte a = 1; a < 127; a++) {
    Wire.beginTransmission(a);
    if (Wire.endTransmission() == 0) Serial.printf("  found 0x%02X\n", a);
  }
}
Expected output #
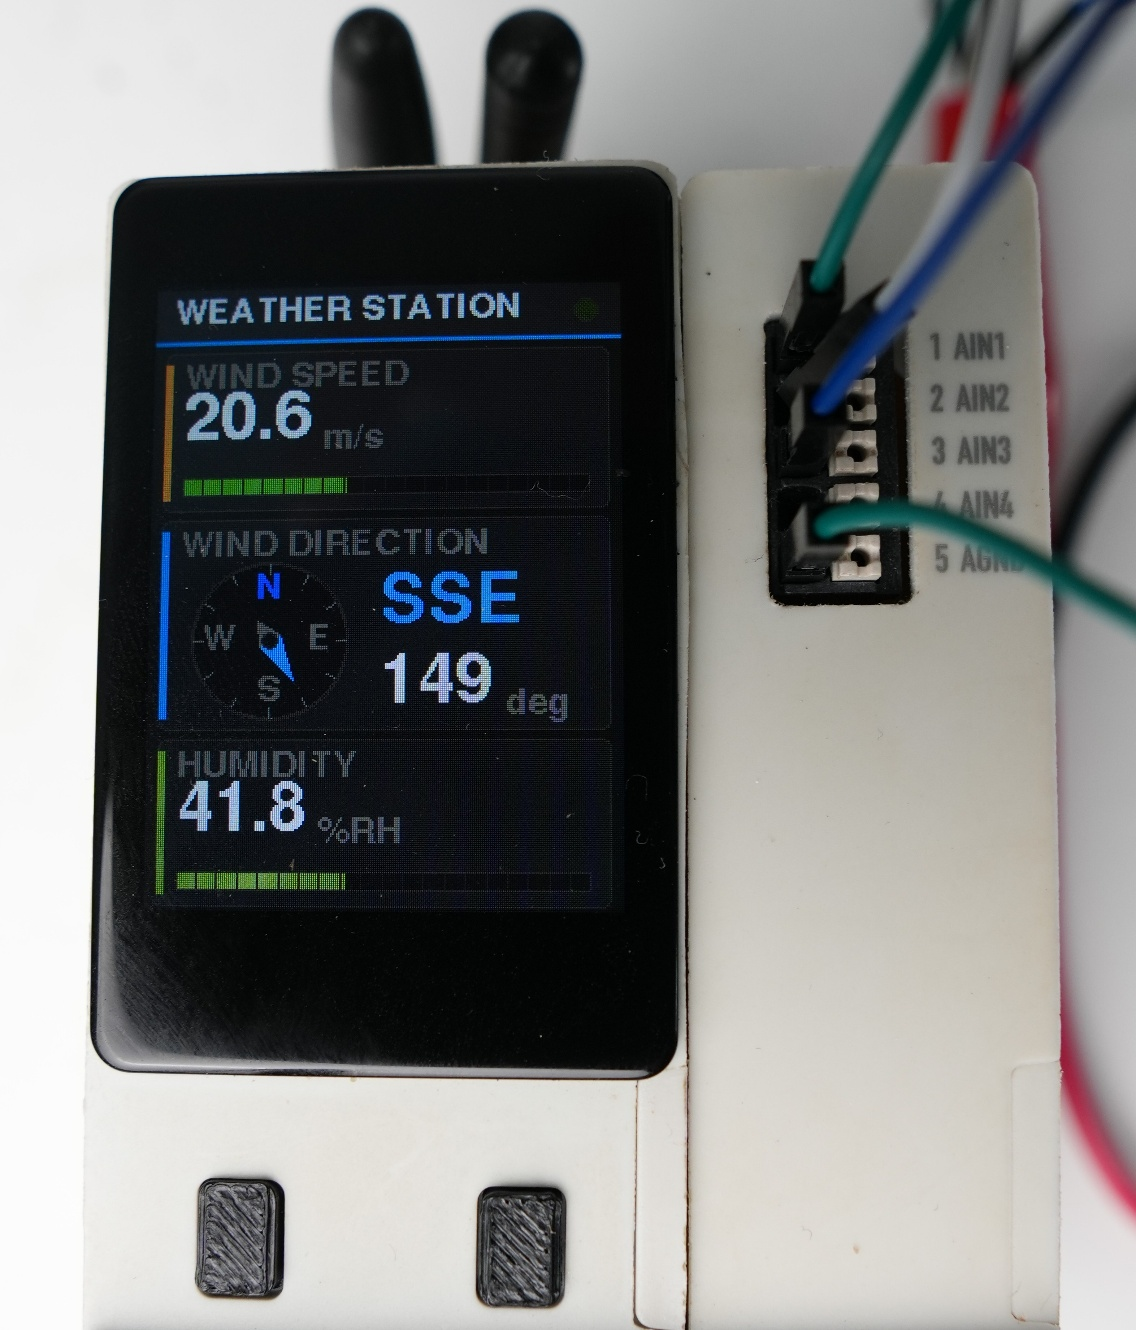
The Serial Monitor prints one line every 500 ms, for example wind=17.1 m/s dir=223 deg SW hum=58.5 %. If the X-AV4 does not answer it prints X-AV4 not found. Figure 4 shows four display states, and Figure 5 shows the finished device running with live readings.
Troubleshooting #
| Symptom | Likely cause | Remedy |
|---|---|---|
| Display blank or white | Wrong SPI pins, display bus not initialized, buffer not allocated, or Tools settings | Confirm CS 45, DC 46 and RST 47 in the LGFX class. Set USB CDC On Boot, Flash Size and PSRAM as in 7.1. |
| Display flickers or shows noise | Ethernet or SD chip-select lines floating on the shared SPI bus | In setup(), before tft.init(), set pinMode(1, OUTPUT) and pinMode(42, OUTPUT) and drive both HIGH. |
| “—” and “no X-AV4” on all channels | Module not seated, or DIP address does not match ADS_ADDR | Power off and reseat the X-AV4. Set DIP 1 ON for 0x49 and run the I²C scan. |
| FAULT on one channel | More than 10.5 V on that input: wrong sensor variant, supply voltage on the signal wire, or a faulty transmitter | Power off and check the wiring. Confirm a 0–10 V variant (-10 or -40) and measure the terminal voltage. |
| Reading stuck at zero | Signal wire open, transmitter unpowered, or sensor 0 V not tied to AGND | Check the supply at the transmitter and the voltage between AIN and AGND. |
| All values wrong by the same percentage | DIVIDER differs from your module | Calibrate with a known voltage (Section 5.3). |
| Humidity low at high humidity | Output loaded by the X-AV4 input, or wrong range or output mode | Check 0–10 V mode and the 0–100 %RH range. Add a 0–10 V buffer if needed (Section 3.3). |
| Noisy or erratic values | Cable pickup, unshielded cable or a ground loop | Use shielded twisted pair, ground the shield at one end, keep away from motors and relays, and raise SAMPLES. |
| Direction wrong by a fixed angle | North mark of the vane not aligned | Rotate the mounting, or add an offset to the angle in the sketch. |
| Reset or sag when heaters switch on | Supply too small for the sensor heaters | Size the supply for up to 20 W per heater, or use a separate heater supply. |
Safety. Disconnect all power before wiring, and let a qualified electrician install the system. This display provides indication only. Never use it as a safety function.
FAQ #
No. The ESP32 inputs only accept up to about 3.3 V and its own ADC is noisy and non-linear. The X-AV4 divides the signal down and a 16-bit ADS1115 reads it cleanly over I²C.
Direction wraps from 360° back to 0°, so a plain average of readings on either side of north points the wrong way (Section 6.1). Summing sines and cosines avoids that.
Set WIND_MAX_MS to the transmitter’s full scale at 10 V. For another humidity range set HUM_MAX_PCT, and make sure the transmitter itself is set to the same range.
Yes. Wire it to AIN4, read it with readVolts(3) and apply your own span. Two X-AV4 modules on one bus need different DIP settings and a separate ADS1115 object each.
A 0–10 V signal is simple and cheap, but it is more sensitive to cable length and noise and has no live zero to reveal a broken wire. For long runs choose a 4–20 mA transmitter and the X-AI4 module.
Conclusion #
You now have a working ESP32 weather display that reads humidity, wind speed and wind direction as 0–10 V signals on the X-AV4, scales them to %RH, m/s and degrees, filters them with an averaged and circular-mean read, and flags faults on the X-CPU display. To go further, publish the readings over MQTT or Modbus, log them to the SD card, add 10-minute averages and gust values, or drive a relay output when wind speed passes a limit.
Resources
NORVI X-CPU-ESPS3-X1 user guide | NORVI X-CPU-ESPS3-X1 datasheet
NORVI X-AV4 datasheet | Code on GitHub: Weather monitoring system on X-AV4
Sentera DSTHX-3 datasheet | WG2/O and WRG/O datasheets (FuehlerSysteme)